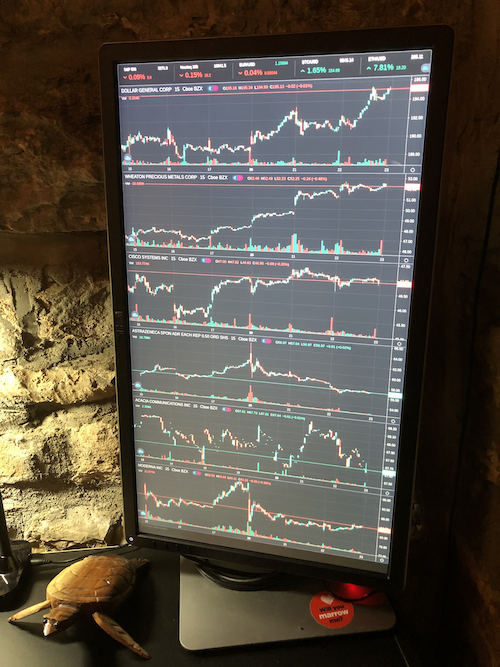
While I love working in Node.js, I agree that it’s rather beginner-unfriendly, and other languages can do incredible work with fewer lines of code. Still, I love it, and learning it has been a wonderful experience. Today, I want to share one of my early Node.js projects: A static webpage to constantly display my current stock positions.
First: the problem. The markets are extremely volatile, and while I’m usually pretty good at checking my own positions, I can sometimes be side-swept by large and unexpected changes. I sought out a solution. Luckily, I had also gotten my hands on a Raspberry Pi 3, so I knew that it would be a part of this project.
Now, the code. When I develop in Node.js, I often use a templating language called EJS in the front-end, in order to easily pass data from Node.js into HTML. EJS is great, because it lets me run loops and form-validation straight in the HTML without ever having to see any back-end JavaScript. This was very useful for this project.
Before you go on thinking that I created the dense, feature-packed candlestick stock price graphs, I did not. I instead just got lucky, and found out about tradingView, who provide free, embeddable HTML graphs for developers and data-whiz brokers. All I really had to do was to find a way to pass my current positions from an external database into the widgets’ parameters. My answer? EJS!
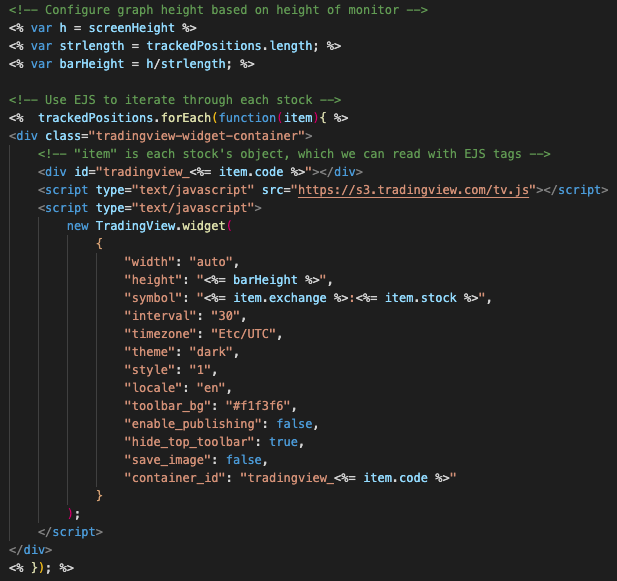
There’s a lot here, so I’ll walk through it. First, I want to calculate the correct height that each graph should be. For example, let’s say my computer monitor is 2000 pixels high (I’m doing all of this on a monitor in “portrait” mode), and I have 5 stocks that I want to track. First, I need to get the view height of the monitor, and then divide that height by the number of stocks in my database. This will result in graphs that are 400 pixels tall, and thus they’ll all fit on the screen. Remember, this is all going on a Raspberry Pi, and I’m not going to hook a mouse up to it, so scrolling is not allowed!
Next, I take my stock positions, which are being passed in as an array of objects from Node.js, and loop through them with the help of EJS (notice the non-standard HTML tags, like <% %> and <%= %>. That’s EJS.). That way, I can create a TradingView widget with the correct parameters for each graph.
Configuration takes place in a password-protected config page, where I can add and delete stocks as I buy and sell. Eventually, I plan on connecting this project with the TD Ameritrade API, so I can simply login and fetch my stocks, which would be a lot faster. The only potential issue is that nomenclature may differ between platforms. For example, TD Ameritrade lists exchanges for ETFs and Index funds slightly differently than TradingView will accept, so I’d need to figure out a way to “translate” my stocks into TradingView terms first.
But that is a project for another day…
Back to Projects