When it comes to finances, I feel like I’m always adding new accounts. Whether it’s a student loan, new credit card, or investment account, each new service comes with its own online platform with its own login information and user interface. It can be quite annoying to try and keep up with each of them regularly, so with the help of Plaid, a service that allows third party apps to read financial data from hundreds of different platforms, I built a solution.
First, I’ll start with Plaid. I’m very happy I found it, because Plaid’s developers have already created the infrastructure to communicate with even the most obscure financial institutions, such as regional credit unions and federal entities. Without Plaid, there’s no way I would have been able to obtain developer access to many of these platforms. Next, I set up the Node.js application.
The application I wrote simply uses the Plaid API to generate an access token that can be used for a certain amount of time. Then, every hour, it runs a series of functions that:
Check the validity of the stored access tokens for each connected account, updating any that may have expired since the last time the function was executed,
Make API calls to Plaid, which then makes secure requests to each financial institution for an updated account balance,
And write the returned values to a spreadsheet hosted on Google Sheets, using the Google Sheets API.
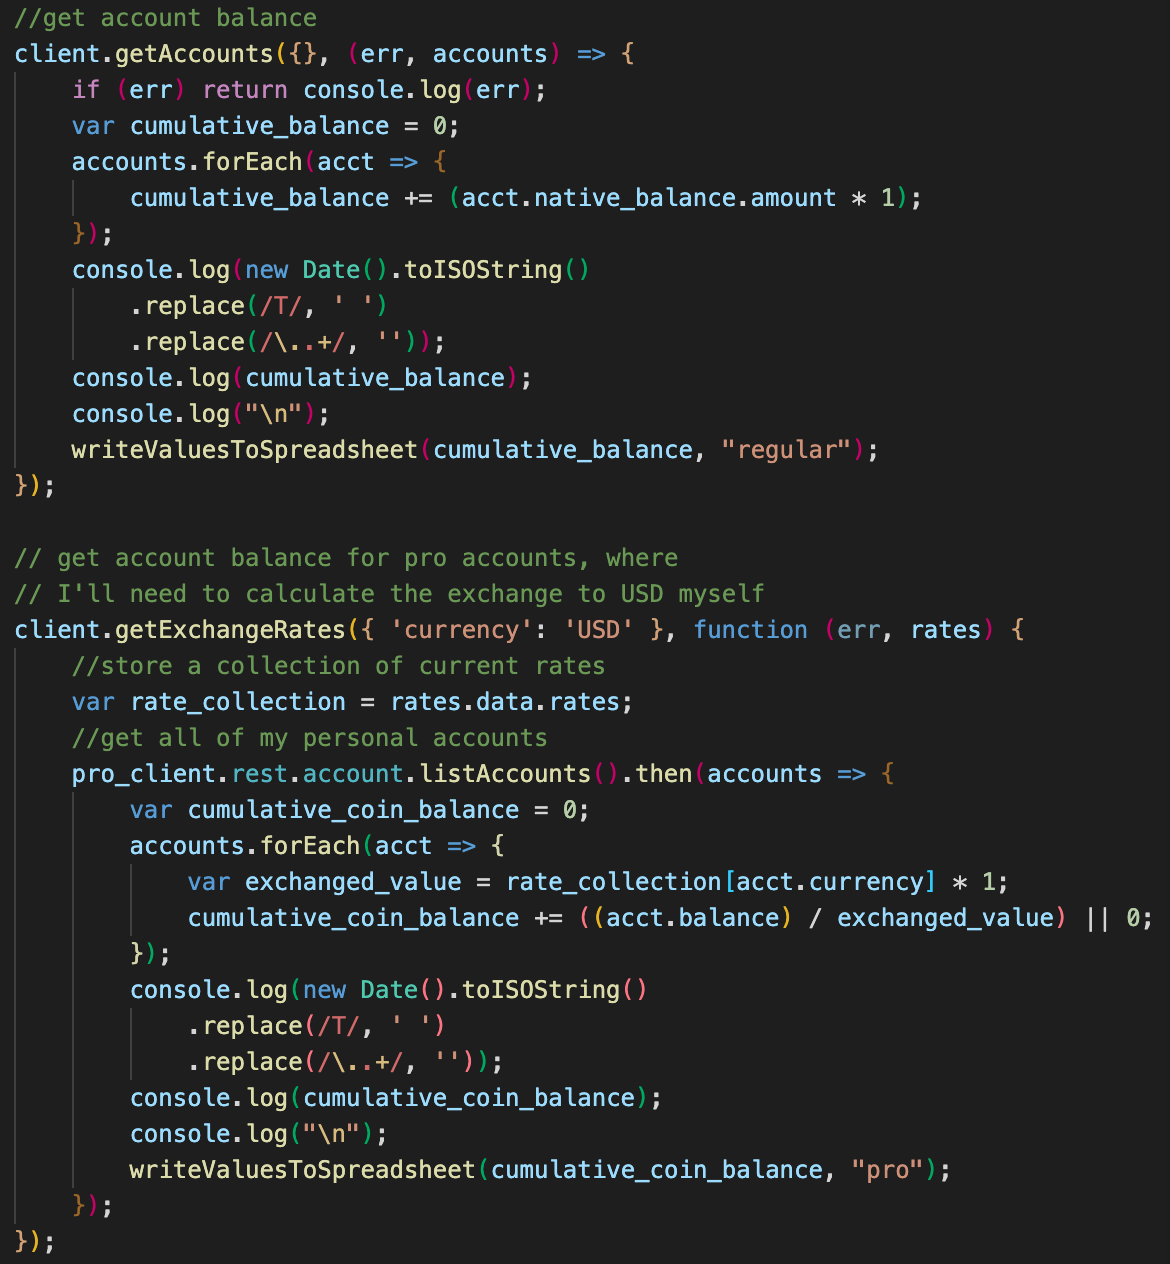
For some trickier accounts, a Plaid integration was not possible, so I had to create my own integrations. The basic steps are similar, but I ended up writing completely separate applications for some accounts. You can find the code for my Coinbase cryptocurrency account integration on GitHub here. The basic steps still applied here, but because the API is somewhat different, I actually had to fetch the exchange prices between different cryptocurrencies and USD and calculate my portfolio standing based on the current exchange rate. (You can see a little bit of that action in the main photo of this article.)
Now that my 13-or-so financial accounts have all been connected this way, my spreadsheet is complete, but it’s not very helpful. It’s just a table of balances for different accounts. To make it more helpful, I designed a report on Google Data Studio, which I love for all things data analysis! A sample of that report is pictured here! (With all of the numbers zeroed and recent account history withheld, of course)
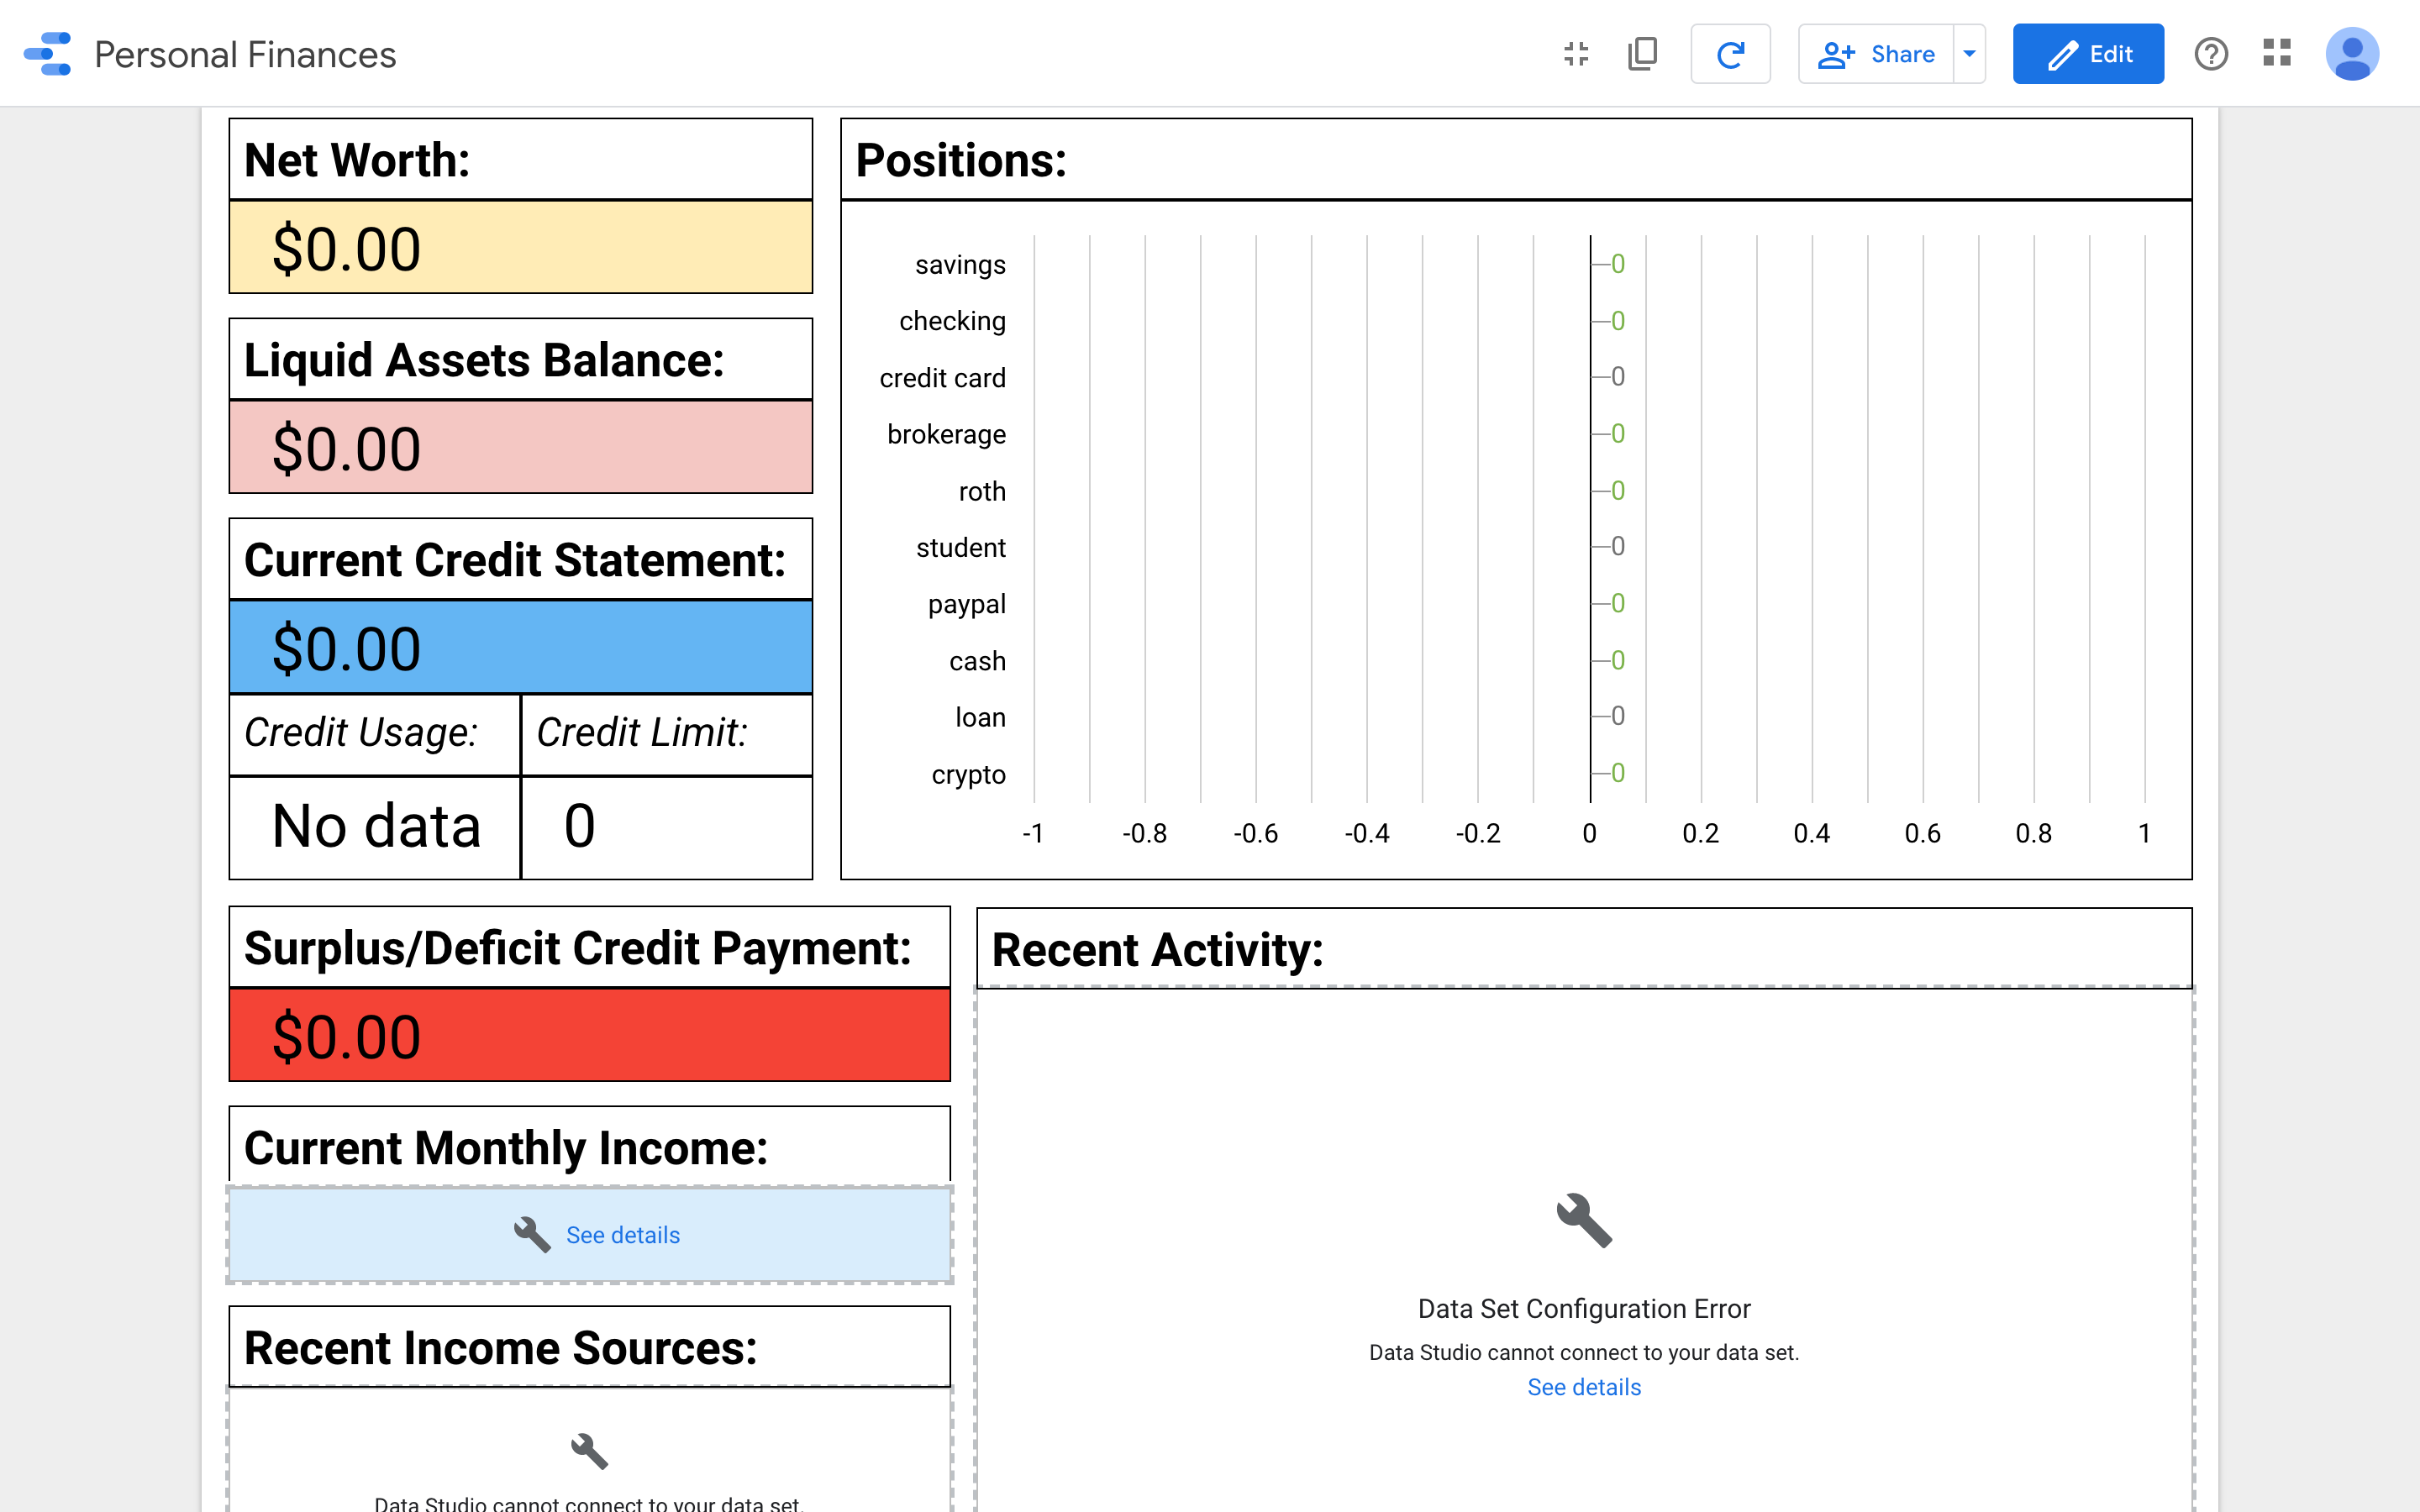 Some of the metrics that are really important to me are my net worth, outstanding credit card balances, and my liquid assets, like cash and checking accounts. I also like to see when my credit limit increases every now and then!
 One of the best things about Google DataStudio is that you can send email updates regularly. Every morning at 4am, I get an email updating me about my recent financial data, all in one place. That way, it’s something I read as soon as I get up, and if there are any discrepancies, or if one of my investment accounts plummet overnight, I’ll know about it.
The next step of this project is to get the DataStudio report on a Raspberry Pi, so I can have a screen in my house that is always showing me my financial data. That’ll be my first project of 2021!
Back to Projects